Researching and analyzing images from social media through software and presenting that through an Image grid, Audiovisual collection and Supercut
Carlo de Gaetano, researcher at Lectorate Visual Methodologies
Exploring Imaginaries is a form of qualitative research that uses visual media to collect, display and analyse. Exploring Imaginaries gives you the opportunity (primarily) to get a clear overview of how your topic is presented on the Internet, during the discovery phase of your research. The data you collect can lead you to a different perspective on your chosen topic, this can help you create new images around that topic. In addition, making your research visual helps you further in continuing your research because a visual aspect can help you to see your research in a new light, which strengthens a research proposal.
By gathering data from TikTok videos, researchers can gain insight into how different subgroups interpret a topic and how people view it online. Additionally, researchers can use the metadata from videos such as the text, hashtags, and comments to gain further information about the topic. With this data, researchers can gain a new perspective on their research topic, and decide which direction their project should take.
TikTok can be a powerful tool for visual methodology. Through its range of effects, filters, and editing tools, users can create unique visuals that can be used to explore research topics. But other social media such as Facebook or Instagram could also work very well.
The climate crisis is also a crisis of the imagination ~ Amitav Ghosh
What does this mean
Despite having sufficient knowledge of the planetary emergency, world leaders are not taking adequate action to tackle runaway climate change. The problem is therefore not so much technical in nature; it is rather a lack of vision.
For this method, the first thing you need is the Firefox browser to install a few programs. Below is a list of what you need to install and a quick description of the program.
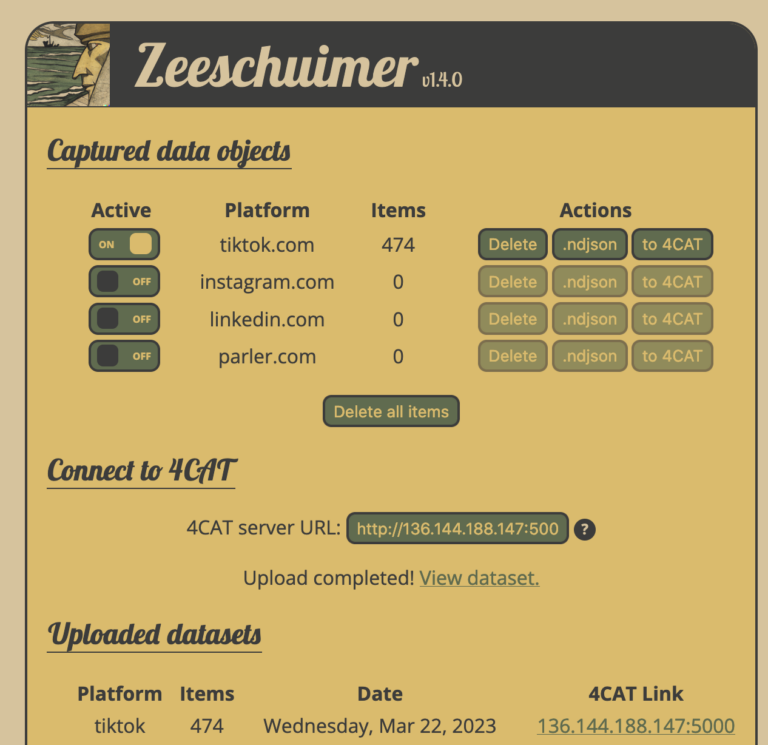
1. Zeeschuimer
Zeeschuimer (Image 1) is an extension for the Firefox browser, which can fetch data from Tiktok, Instagram, LinkedIn and Parler.
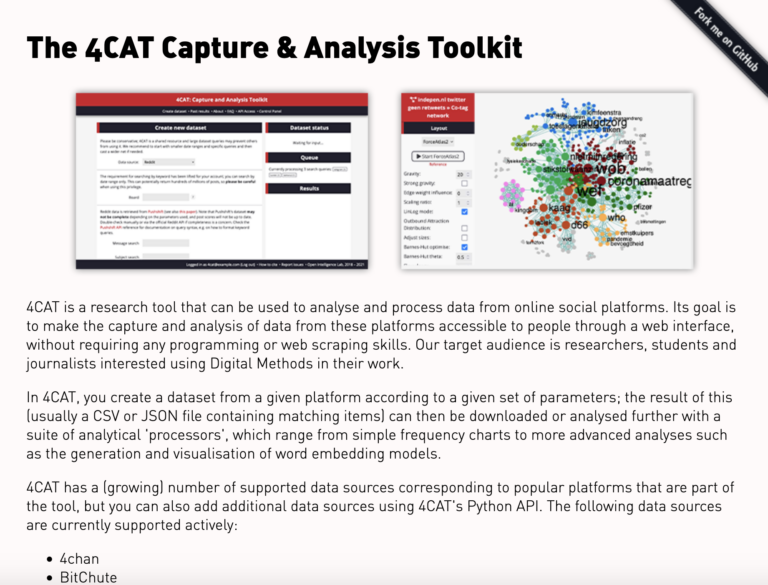
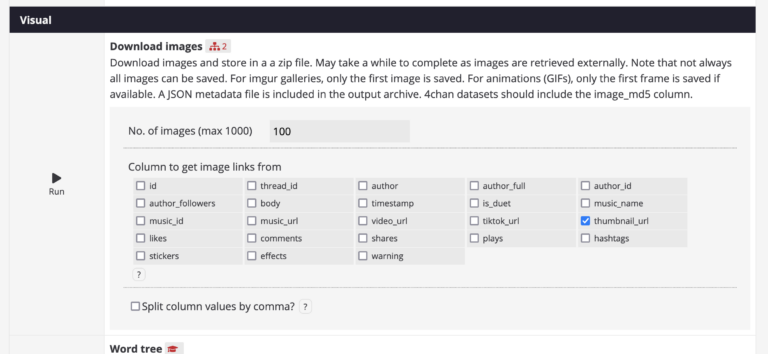
2. 4Cat
Here you can process and analyze your fetched datasets. There are many different creative ways to analyze your datasets. (See Image 2)
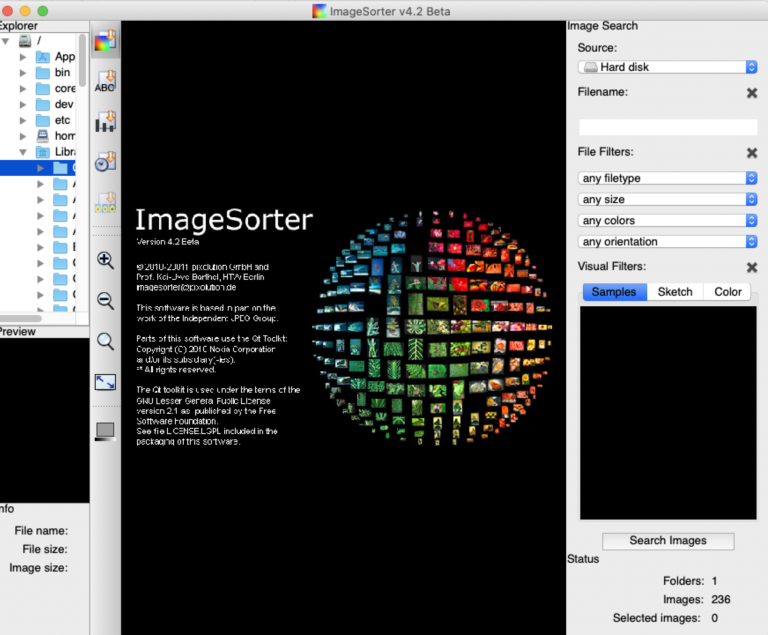
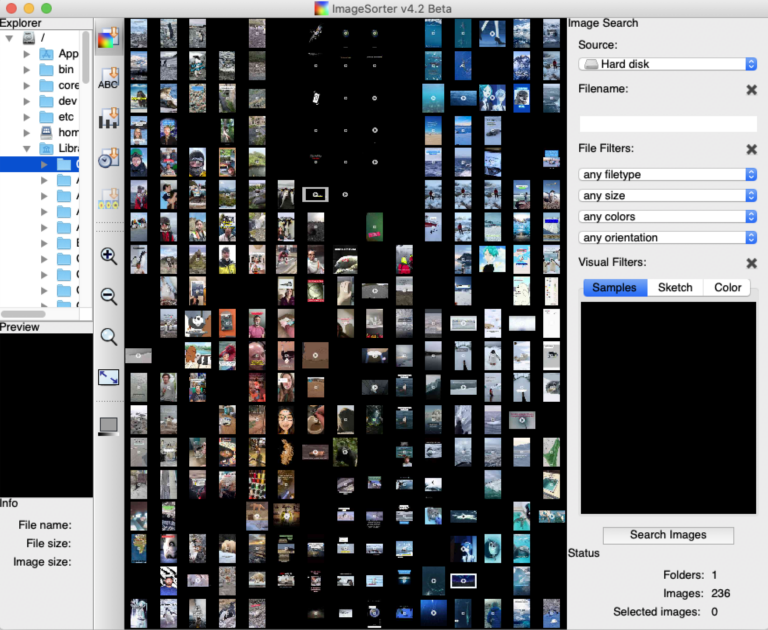
3. Image SorterV4.2
Image Sorter (Image 3) allows you to have a collection of images sorted by different categories.
To start, create a new account on Tiktok to make sure you don’t get personalized results. Once you have done this go to Zeeschuimer and perform the following steps.
Now you go to Tiktok and here you enter keywords for your topic, look for what kind of results you get and what you need for the right results for your research question.
Once you have entered a keyword go and scroll through the results, the longer you scroll, the more results will be included by Zeeschuimer. Once you have enough Tiktoks for Zeeschuimer, you can click ‘to 4Cat’ in Zeeschuimer under ‘actions’.
After this, a link appears under ‘Connect to 4Cat’ with ‘View dataset’.
If you click this, you will go to the dataset in 4Cat. Here you can have your data exported to a .csv file, which you can open in Excel or Google Sheets. In it you will see the data of all the collected Tiktoks, such as number of likes, views etc.
If all is well you should see a column with ‘Thumbnail URL’, create a new column to the right of this, called ‘image preview’. Now type in that column =IMAGE(x) and instead of the x enter the number of the cell where the thumbnail url is, for example ‘K5’. Double-click on the edge of the cell where you entered this, to do this to the whole column. This will show you the images at the Tiktoks.
Supercut Video
To create a nice overview of your research results, you can make a Supercut video. This is a compilation of videos, TikTok’s in this case, from a certain category. You can use Kapwing for the editing of the video. In Kapwing, you can import Tiktoks by pasting the link, which you can find in the sheet under ‘TikTok URL’. You can also go through the sheet and pick TikTok’s to use for the supercut, by looking at the image previews.
Image SorterV4.2
Another way to create a nice overview, is using Image Sorter to sort your TikTok thumbnails on color. This way you can see what themes play a role in your research. You can look at the most common colors in the overview and think about what that color tells you.
Here is a guide on how to use Image Sorter:
Collage
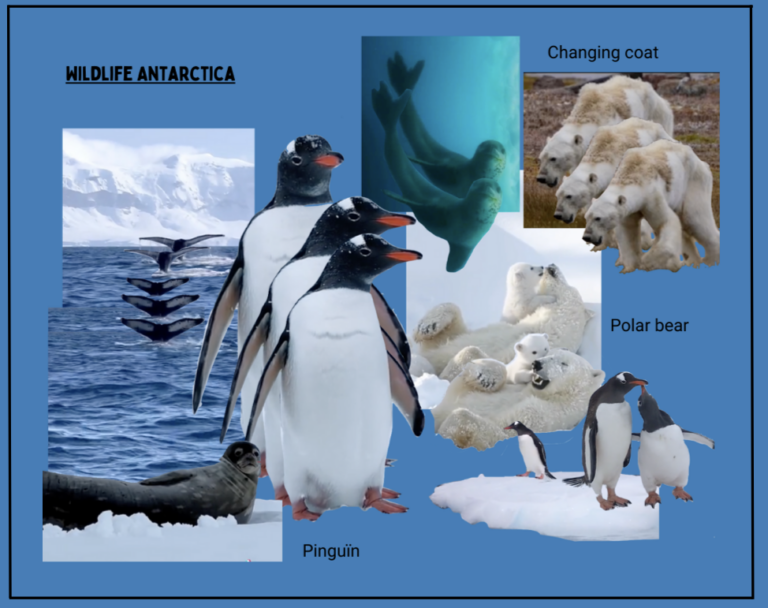
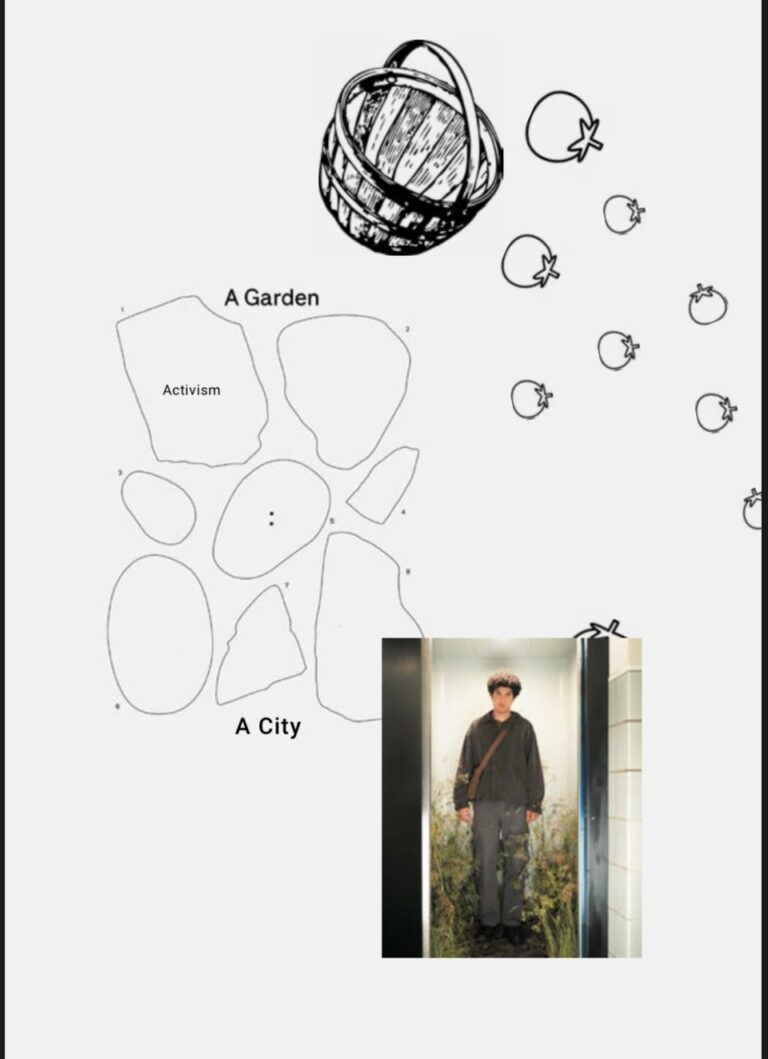
The last method you can use, is a collage. You can take the thumbnails, but also images from other sources, to create a collage that represents your research and the results you got. You can play with sizes, to prioritize certain things or objects. Also, you can add words or more colors. See image 6.
Images and videos shared on the internet contain valuable metadata such as timestamps, hashtags, likes, captions, and comments. This metadata provides a network of information that can be used to establish connections between different media. For example, images and videos containing the same hashtags may be linked together.
Visual methodologies are powerful tools that allow researchers to quickly and effectively process large amounts of media data. By using these methodologies, researchers can filter and analyze the top results and monitor changes over time. Additionally, researchers can identify gaps in the data.
Furthermore, visual methodologies can be used to identify popular clusters of images and videos related to a specific research topic. This information can provide valuable insights that can be used to further investigate the topic.
In terms of video content, the same principles apply – metadata associated with videos can also provide valuable information for researchers. For example, video descriptions, comments, and tags can be analyzed to establish connections between different videos and to identify trends within a specific research topic.
At first, this process may seem complicated due to all the information and the many steps involved. However, with practice, it becomes easier to understand and apply in your own research.
Designers generally may not be used to dealing with massive spreadsheets files with links, photos, and other things like hashtags as a part of their regular work. This can be a challenge, especially when a precise order of steps must be taken, as it could otherwise lead into failure if done slightly incorrect.
In the end, the steps are not too hard to complete, so anyone with a bit of experience behind a computer could use this method for their research.
Pro’s
Con’s
To successfully use this method of research, it is important that you have a clear research question(s). This will make your researching images/videos easier. When you start scraping images/videos with the right search terms, you will make interesting and innovative findings for your research.
Depending on what you are looking for, adjust your tone of voice. On Tik Tok short, young words and trends are used often, recognize and use these to make your research relevant.
If you follow the method properly, you will determine an analytical framework, for example different categories, based on your clear research questions. This will make it easier to use other applications such as Wordwanderer.
Using applications like Wordwanderer, will ensure that you can take a clear research direction. These applications will bring out the most common words in your data analysis. You can then look for subterms within those popular terms, which will enable you to specify your research.
This method is quite intriguing; when analyzing the data, one is presented with visible, profound patterns. However, it is the researcher’s responsibility to determine how far down the rabbit hole they will go. Ultimately, one must employ their intellect to identify these patterns.
The exploratory phase of your research project can be immensely improved by the use of this method because it can help you to decide which direction to take. Alternatively, if you have already specified a certain path, this method can be used to confirm your assumptions or break down your research question into smaller pieces.
A supercut video is a type of video montage that features a compilation of short clips from multiple sources centered around a particular theme. In this particular supercut video the creator used the videos to draw attention to a certain topic. However, a supercut video might show clips of characters saying a particular catchphrase, or moments when a certain type of camera shot is used. By showing how a common element appears in different contexts, supercut videos can create a powerful impact, highlighting the ubiquity of the element and its impact on culture.
Image 6 shows a collage with just a few items, but still it gives out quite a strong vision about the subject of the research.
In some cases it could be more useful to have a more filled collage, especially when working with a more vague subject.
When creating an imagegrid, one will be able to see very different patterns. The images can be sorted by color, this way it will be very easy to distinct different locations or themes. See image 5.
Photovoice is a method where you collect photo’s in different categories, to get different perspectives on certain themes. This is kind of like the image sorting, because you notice different categories and you can really see the different perspectives on some subjects.
There is also a remote version of Shared Photovoice, which can be very useful. Click here to learn more.
Netnography is also a data collection method that deals with social media and where you research what is being posted and what content is out there. The difference is that netnography focuses more on the depth and specific conversations or posts. You research the behavior, experiences and the meaning of those experiences and the content.
Frederique Stal, Tara Bodewes & Mick Oost Lievense